$20 Bonus + 25% OFF CLAIM OFFER
Place Your Order With Us Today And Go Stress-Free
Machine Learning for Store Sales Projection in Supermarkets
The results of this study describe the dynamics of retail activities by analyzing store-related metrics and sales data comprehensively. The research is organized in several stages, starting with feature engineering aims to augment the data set and uses exploratory data analysis (EDA) for a deep knowledge of its properties. In particular, clustering methods indicate distinct groups of customers allowing for specific strategies.
The very first model training with zeroed-in feature engineering sets a baseline which allows exposing the limitations of linear regression. More recent model versions, including Decision Tree, XGBoost , CatBoost and Random Forest , show significant lift in predictive precision.
Feature Importance Analysis provides the nuanced insights which guide strategic decisions. The study reaches the conclusion that leveraging feature engineering, EDA, and advanced regression models in a synergistic approach improves prediction capabilities which will be critical for informed decision-making over time to propel retail analytics forward.
Machine learning ML technologies have completely changed various industries, and the retail sector has become a crucial centre of this technological wave. Within the recent years, increased focus has been cast on the use of ML in prediction of sales at a store as this technique has great potential to enhance the decision-making processes and efficient resource allocation.
In this research, the store sales projection in supermarkets is explored through the lenses of machine learning with a view to expanding what is already known about this topic and helping deal with some important issues faced by the retail sector today.
It is from the increased need for supermarkets to precisely predict and forecast sales that such research has emanated from. Traditional methods, which are static and myopic, fail in capturing the intricate and dynamic patterns characteristic of retail data.
For instance, real-world events like the growing trend of online shopping and changing consumer preferences enhance the need for sales projection models that are smart and flexible (Femling et al., 2018; Weber & Schütte , 2019). The deficiencies of traditional methods and the dynamism in the retail environment also demand novel approaches for accurate selling projections.
In exploring the research field, one identifies the problem based on the immediate effects that modern trends in consumer behaviour and technological progress have. Businesses including supermarkets are in a rapidly changing ecosystem and predictive should be able to dynamically scale or adapt to emerging trends and intricacies in customer preferences (Femling et al., 2018).
This research is a significant contribution as it uses machine learning to enhance the accuracy and efficiency of store sales projections in supermarkets. Although antecedent studies have covered the terrain of machine learning applications in general terms, this study’s aim is to restrict its analysis specifically to supermarkets and define more clearly identifiable factors that contribute to sales within such a unique retail scenario.
To go beyond the existing literature, this research presents a specialized approach to supermarkets while recognizing their specific challenges and dynamics. By limiting that scope, the study seeks to provide insights and models which are not only more accurate but also more actionable for supermarket retailers in catering for those nitty-gritties of operation (Kohli et al., 2020).
This research is highly significant because it can provide supermarkets with sophisticated tools for predicting sales letting them better optimize the inventory, staffing and promotional strategies. Although machine learning integration in the supermarket context faces the complications of store-level sales forecasting, this solution is customized to the specific challenges this industry has (Kohli et al., 2020).
Further elaborating the importance, it can be stated that the research results are going to not only inform on a theoretical level about ML applications in retail but also influence toward operational improvement of supermarkets.
The study aims to provide practical and actionable findings that can make a tangible difference in the sales forecasting and management practices to address some of the specific challenges that supermarkets are facing (Weber & Schütte, 2019).
This research is based on the foundation of existing studies and further develops established machine learning methodologies for sales forecasting. ( Femling et al., 2018), (Weber and Schütte, 2019), (Kohli et al., 2021) are pioneering works that have laid the foundation for different ML techniques like regression, neural networks etc., to be used in prediction of sales through retail store. This research adheres to these approaches, skilfully modifying and improving them for the particular case of supermarkets.
Speaking about the methodological background, this research is intended not only to apply available ML techniques but also modify them to accommodate supermarket-specific peculiarities. So, this research aims at bridging the gap in the methodological debate about ML applications in retail by focusing on particular variables and challenges that are specific to supermarkets. Thus, it provides a foundation for more customized approaches (Femling et al., 2018).
This research aims at the design of an efficient and precise machine learning model for store sales projection in a dynamic supermarket environment. The main objective is to give supermarkets a state-of-the-art instrument that exceeds conventional forecasting approaches, with increased accuracy and flexibility.
The first specific goal is related to a detailed analysis of how different characteristics such as store size, goods offered for sale and average number of customers daily influence the sales. Supermarket sales are complex affairs that depend on multiple factors, and the marketer must therefore understand them completely since all these factors together shape the aspects influencing consumer buying patterns.
This is due to a level of understanding that the characteristics of a store, customer behaviour and sales performance are interdependent. This research dissects and analyzes these specific features in order to reveal nuanced patterns, relationships, offering a detailed understanding beyond standard sales projections.
The other cause, as the second one refers to development and validation of a machine learning model that is specifically created in order to deal with the diversity of dynamics in supermarket retail environment. This purpose seeks to take advantage of the power of machine learning in order to create a model that is tied to the distinctive challenges and complexities, as well as the unique operational business characteristics found within supermarkets.
Cultivation is a continuous adjustment of the model until it becomes suitable for the environment that is constantly changing gears on customer tastes and market trends. It is on the opposite that validation proves that the model is reliable and accurate in transforming data inputs into tangible sales forecasting.
Identifying such objectives is built on a thorough understanding of the intricacy of supermarket sales. Traditional forecasting methods come up short in landscape shaped by a multitude of factors such as layout of store, products that are available and customer footfall. (Kohli et al., 2020) emphasize the need for a more subtle approach, one that probes into specifics about store-level dynamics. In this way, focusing on certain characteristics, this research aims to untangle the intricate dynamic between different components in order to guide purpose-driven interventions and enhancements.
The reason for this work is based on the fact that supermarkets have to pay special attention to adopting high tech forecasting techniques, which are indicated as a sort of lynch pin her their competitiveness in an environment of retail market dynamics. The insights obtained from this study carry the potential to redefine the manner in which supermarkets approach sales projection, paving the way for a more informed decision-making as well as strategic planning.
Continuing the rationale, this study acknowledges that supermarkets need to be at the forefront in a highly competitive and rapidly changing retail environment. Adopting modern forecasting techniques, supermarkets can match and even exceed customers’ expectations as to a smooth shopping experience with constantly developing consumer habits and preferences (Weber & Schütte , 2019).
In the following chapters, we go into a thorough review of studies published beforehand, elaborate on our methodology used in the study appropriately and provide as well as discuss the results obtained by using machine learning practices for predicting supermarket store sales. The journey unfolds to reveal the complex dance between store attributes, customer behaviour and sales in the world of supermarket retail.
The utilization of machine learning (ML) techniques in recent times has arisen as a revolutionary tool in the retail industry that provides novel resolutions to numerous problems. This literature review aims at investigating the various areas of machine learning applications in the retail sector especially on supermarkets and store sales prediction.
The 21 st century marked dynamic changes in consumer behaviour and technology that is changing retail dynamics even faster than ever before requiring more complicated models for forecasts. 0 The exploration is initiated from the consideration of ML applied to retail applications, with the impact of (Femling et al., 2018) and (Weber Schütte., 2018).
The next portions will focus on regression methods in the forecast of sales, then why predictive maintenance is so important when it comes to supermarkets and returns specifics for this industry and lastly how machine learning and deep learning come together during retail sales prediction.
In recent years machine learning algorithm ML has become an extremely powerful tool in the retail industry, creating innovative solutions for a broad range of problems. Another ML application is discussed in a report by Femling et., 2018 that focuses on fruit and vegetable detection in retail environments.
Further, the authors contribute greatly to retail applications by selecting ML techniques that increase the accuracy of fruit and vegetable classification. The employment of ML technology may enable retailers to streamline inventory management, lower the amount of categorization mistakes related to products in stock and improve customers’ shopping experience significantly which can be reflected in higher levels of customer satisfaction.
(Weber & Schütte, 2019), offer a sector-specific ism focusing on machine learning and its impacts, especially in the domain of retailing. Finally, this study admits that the retail industry presents several complexities and attempts to identify some ways of customizing ML interventions targeted at dealing with these unique challenges.
However, (Weber and Schütte, 2019) put great emphasis on domain-specific strategy stating that machine learning solutions in retailing need a special approach. This research reveals that machine learning might result in enormous transformations within retail business, as it is capable of comprehending the complexity associated with how a retail business operates.
In the larger trend of categorizing and identifying retail commodities using ML is a particular study by (Femling et al., 2018). The proper identification of fruit and vegetables has several significant consequences for optimizing supply chain, the pricing strategy implementing, as well as inventory. This is in line with the growing importance of precision in retail operations, where machine learning models enhance task accuracy and efficiency that previously required human engagement.
Building up on this thought,(Weber and Schütte., 2019)’s domain-oriented study of 2019 provides an extensive overview of how ML influences retailing. The research realizes that generic machine learning models would not be able to address the intricate challenges found only in the retail industry, and thus it giving much importance to a domain-specific perspective. The study looks at how machine learning (ML) can improve supply chain management operations, customer experience and decision making in the retail sector.
Both studies contribute to the increasing number of research projects on machine learning applications in retail by highlighting the need for adaptability and accuracy that would help optimize the benefits brought about by this technology in this industry.
Let us consider a particular case described by (Femling et al., 2018), the identification of fruits and vegetables, to demonstrate how ML can be modified for accurate objectives in the retail. (Weber and Schütte, 2019) provide a fuller picture that understands the industry-level determinants of how well machine learning could function in retail business.
In summary, when read together these studies provide valuable insights into the numerous potential utilities and considerations that must be taken in mind while considering integration of ML within a practical retail context.
There is a growing popularity in the adoption of regression models when it comes to sale forecasting, indicating that various industries require accurate tools for such kind of forecasts. For example, the literature of (Kohli et al., 2020) is also well endowed with respect to efforts in sales prediction using KNN and linear regression methods.
This study provides important implications on the comparative effectiveness of different regression techniques actually helping to unveil whether and how they can be efficiently employed in forecasting sales patterns.
Another research, conducted by (Bajaj et al., 2020), use the wider scale of machine learning techniques for a study in the area of sales prediction. Besides, they carried out a profound research on various machine learning algorithms for the purpose of predicting sales and released their results in the International Research Journal of Engineering and Technology.
Beyond what has been stated above, the research would enhance managers’ understanding of how such algorithms can predict future events; furthermore, the implications for firms that are seeking reliable ways to forecast sales will also be quite practical.
For instance, the study by (Kohli et al., 2020) reiterates that regressing to various models must be examined so as forecasts for sales can increase in accuracy.
This work is interesting in that it makes new revelations regarding the benefits of using these techniques and their drawbacks when used for sales forecasting by conducting an extensive comparison between linear regression, as well methodology performed.
This technique of comparison will help practitioners choose the most appropriate type of regression model on the basis on characteristics displayed by their sales data.
On the whole, these works add to the body of knowledge by offering a sharp understanding on how regression models can be deployed in sales predictions. Whereas (Bajaj et al., 2020) provide more holistic insight by examining various machine learning methods, such as supervised and unsupervised models, (Kohli et al., 2020) concentrate on a specific comparison of linear regression versus KNN analysis. Overall, these research results add to the already existing body of knowledge about regression models as far as predictions involving sales are concerned; this information will be useful in various ways for companies, practitioners and scholars looking for dependable forecasting tools.
Predictive maintenance has become a more popular concept in recent years offering various industries essential strategies for improving equipment reliability and reducing downtimes. As the discussion above shows, two studies add to pre-existing knowledge by discussing predictive maintenance using different scenarios as well as industrial equipment and supermarket refrigeration systems.
Similarly, research pertaining to predictive maintenance on supermarket refrigeration systems is mostly based only on case temperature data (Kulkarni et al. 2018). This research, presented at the 2018 Annual American Control Conference demonstrates a way on how case temperature data can offer predictive maintenance in retail environments. The study approaches the challenges in creating optimal conditions in supermarkets by focusing on refrigeration systems that play crucial roles in storing perishable items.
Research results help to establish the feasibility and effectiveness of customised predictive maintenance procedures for use in grocery industry, thus giving information on enhancing system reliability and reducing downtimes.
(Ramos et al., 2014) support the trend of manufacture related knowledge by providing an investigation into predictive maintenance for production equipment. The research given at the 21st International Euro MA Conference employs different methodologies such as ARIMA – AutoRegressive Integrated Moving Average and neural network autoregression for building a predictive maintenance model.
The study emphasizes on production equipment and such research projects seek to determine viability of applying novel methods for projecting possible faults in the machinery, as well as planning repair works beforehand. Such approach, built on both traditional time series analysis and neural network modelling, demonstrates an ability of applying predictive maintenance techniques to different industrial environments.
In their research, (Kulkarni et al., 2018) reveal the importance of managing specific types of operational data like a case temperature as far as preventative or predictive maintenance is concerned especially for an environment such as supermarket. The study deals with certain problems, which are inherent to the retail sphere and outlines a particular aspect of supermarket functioning such as refrigeration. The obtained results show the effectiveness of data-driven approaches as ways to stabilize the supermarket system, ensuring that all items stocked are subject to best practises and energy consumptions are reduced.
Furthermore, as (Ramos et al., 2014) reports indicate, the study reveals the benefits of predictive maintenance in terms of manufacturing equipment and commenting on its broader usefulness. The amalgamation of ARIMA and autoregression through a neural network is an in-depth approach to predicting equipment failures. This study serves as an illustration of the fact that predictive maintenance models are versatile in many industrial environments, and it offers lessons that transcend beyond supermarkets.
For instance, altogether these study acts as a significant contribution to the developing comprehension about predictive maintenance because they show that this technology is valid in terms of larger-scale manufacturing settings together with supermarket refrigeration systems.
While (Ramos et al., 2014) demonstrate the usefulness of predictive maintenance techniques in many different kinds of industrial sectors, (Kulkarni et al., 2018) offer insights into how predictive maintenance can be uniquely beneficial and yet also limited when implemented in supermarkets. Such studies provide useful recommendations to implement efficient and purpose-oriented predictive maintenance measures as soon as companies realise the benefits of proactive maintenance approaches.
Machine learning techniques used in predicting food sales have gained prominence as it could lead to revolutionize inventory control and help improve the sales approach. In the Artificial Intelligence Review, (Tsoumakas., 2019) gives a detailed review that offers a general perspective on various machine learning algorithms used to predict food purchasing in advance.
The survey offers an in-depth assessment of the changing issue of food industry sales forecasting by going through a variety of algorithms and methodologies. This work by ( Tsoumakas, 2019) is a credible source of variance because it categorizes and compares the capability of various machine learning algorithms in predicting food sales. These findings provide academians as well as practitioners working on second insight into relevant data.
On this basis, (Kaneko and Yada., 2016) enhance the research results by developing a retail shop sales prediction model based on deep learning technology. Their article aims at understanding the use of deep learning methods to successfully forecast retail store sales and was published in 2016 as part of the 16 th IEEE International Conference on Data Mining Workshops.
Such large volumes of data can assist in more accurate sales projections by enabling deep learning techniques used by the authors to unearth hidden patterns and relationships from such datasets. By focusing on the use of machine learning within the retail industry, this study expands the potential area of application that these methods have and exposes just how versatile they are across a range of different shopping environments.
(Tsoumakas., 2019)’s Survey is one of the most reliable ways to understand with a broader perspective, the field of machine learning methods for sales prediction because it maps out events and nuances in the area.
By providing information as to the differences between various machine learning techniques and their applicability in the particular case of food sales forecasting, the survey represents a basis for understanding the pros and cons of different approaches. That inclusive approach defines a vision path for academics and practitioners to select and employ suitable algorithms based on their individual needs and characteristics of data sets.
A deep learning approach presented by (Kaneko and Yada., 2016) provides a specific implementation of machine learning techniques, adapted for use in retail.
The study shows that more accurate and qualitative forecasts in retail shop sales are achievable using deep learning. What makes this study stand out within the body of knowledge is its demonstration that machine learning, especially deep learning, is a rather flexible tool for dealing with challenges like sales prediction in a retail setting.
This complex network-based methodology provides merchants with a broader array of tools to more accurate and sophisticated sales estimation.
Both the deep learning technique by (Kaneko and Yada., 2016) and survey by (Tsoumakas ussurvey., 2019) contribute towards the knowledge on machine learning for prediction of retail sales. Although deep learning has a specific application in the retail sector, the survey offers an extensive overview of various machine learning techniques employed for food sales prediction.
These studies, considered as a group, increase our understanding of the evolving area of machine learning in forecasting retail sales and offer valuable knowledge to anyone interested in practice or research.
Research and assess of putting in machine learning methods into the routine forecasting process n retail demand has become an important area of study, which can enhance accuracy by taking into account some specific calendar holidays. (Huber and Stuckenschmidt., 2020) carry out research that is published in the International Journal of Forecasting is a significant contribution to this discipline.
The research is directed towards the machine learning and its significance on improving the daily demand forecasts for product or services in a retail environment, with much attention being given to factors such as calendric special days. This study is a focused effort that recognizes this small holiday effect on consumer behaviour as well as understands the complexities of the retail environment and opens up possibilities for more complex forecasting models to be developed.
(Sekban., 2019) developed a master’s thesis about analyzing machine learning algorithms to forecast parallel sales. The study can serve as a generalized model of machine learning use in forecasting sales for the similar retail. The study by (Sekban., 2019) presents an important point of connection between theoretical ideas and practical application, as it focuses on the topic from a general perspective of employing machine learning in retail sales forecasting. The thesis would help to understand the practical implications of machine learning algorithm implementation within competitive and ever-changing retail sector.
A conferment aspect can understand calendric special days as the ML is a predicted retail demand (Hubern & Stuckenschmidt, 2020). This study notes a significant aspect of consumer behaviour that is influenced by specific days such as holidays or sales and acknowledges the need for innovation in creating mechanisms to discern demand forecast future. This study is thus helpful in enhancing the daily retail demand forecasting methodology and for better analysis of consumer behaviours within the retail industry.
And this also reveals itself and gained a conformation from the above when we will see what the thesis – (Secenter et al, 2019) tells us with regards to giving an overview of machine learning techniques sales forecasting-wise so all in all this strengthens our argument.
The study is also not restricted to just daily forecasting, but can offer insights into the use of machine learning in store sales trends prediction. As a research-oriented study, the thesis comes out as an invaluable instrument for practitioners intending to use machine learning algorithms and incorporate them stakeholders in their sales forecasting strategies due to its analysis that meets reality.
Together, these studies have contributed to our general understanding of machine learning in the application of demand forecasting for retailers in two separate views. In this research, (Huber and Stuckenschmidt, 2020) examine a few less known dynamics inherent in predicting the day-to-day retail demand – particularly the role played by calendar holidays when determining such demands.
Contrary to that, the master’s thesis by (Sekban, 2019) offers an in-depth discussion on the application of machine learning algorithms for sales forecasting but developed primarily for other purposes within the retail industry. Taken as a whole, these studies fuel up our understanding of the broad range of usages and features requiring scrutiny in addressing machine learning as an element affecting retail demand forecasting, which is still developing.
Numerous strategies have emerged as a result of the development of predictive modelling techniques, but two stand out as particularly important contributions to the field of retail sales prediction: machine learning and deep learning. “A comparative study on machine learning and deep learning techniques for forecasting big Mart item outlet sales,” (Agbonlahor, 2020), centres deeply in the aspect of retail sales prediction.
This research, which was done in Dublin Business School gives an insight of a comparative study on the effectiveness between deep learning and machine learning methods in sales forecasting for Big Mart item shops.
To understand the advantages and disadvantages of deep learning versus machine learning, one will want to peer into the rabbit hole known as Chapter “Analysis,” which gives you all need to know about how either technique performs when applied to a particular scenario where retail sales forecast is concerned.
Also, in the literature, (Penpece and Elma., 2014) present a case study concerning sales revenue forecasting in the grocery retailing sector. They have released their publication about the application of artificial neural networks (ANN) concerning sales revenue forecasting under International Journal of Trade, Economics and Finance.
The Turkish case is an illustration of how modern methods are used outside the laboratory environment while purchasing groceries. The study focuses on the possibility of neural network models generating accurate predictions in the complicated and ever-changing atmosphere of grocery retail using ANN.
Firstly, the comparison research by (Agbonlahor, 2020) provides useful information to deepen the on-going debate on deep learning and machine learning applications in retail sales forecast. Through direct comparison of these methods within the specific environment of Big Mart item stores, the comprehension of the pros and cons associated with machine learning and deep learning methodologies is enhanced.
The outcomes highlight the importance of an individual approach depending on the peculiarities of the retail environment and have a certain practical value for companies striving to enhance their predictions sales performance.
(Penpece and Elma, 2014) case study extends this topic illustrating this issue as to how artificial neural networks are actually employed in the supermarket retailing market for predicting sales revenue. The study discusses how sophisticated modelling methods are quite flexible and the fact that foresting accuracy requires strategies that vary from one situational of atsorable information to another.
This case study provides an exceptional guide to the potential provision of enhanced forecasting facilities within the grocery retail sector and a valuable reference source for practitioners seeking to utilize artificial neural networks in pursuits associated with grocery retail.
Overall, by offering a dual perspective on the subject matter, these researches combined contribute to knowledge related to predictive modelling in retail sales. In the case study by (Penpece and Elma., 2014), artificial neural networks are utilized to foresee sales revenue in the grocery retailing business segment, while (Agbonlahor, 2020) comparative study provides an in-depth review of machine learning and deep learning methods for Big Mart item outlet sales.
Though considered individually, these studies enhance our understanding of the number of uses and complete considerations to be made when implementing such advanced modelling approaches for retail sales forecasting in an always evolving landscape.
Thus, within an extremely complicated sphere of supermarkets and sales projecting, in the permanently fluctuating environment of the retail sector, this exhaustive literature review zeroes in on one potent transformative tool machine learning ML applications. The inquiry began by framing a critical analysis of ML in retail based set-ups, asserting that niche-centric solutions addressing the unique challenges inherent to this domain are required.
The works performed by (Femling et al., 2018) and (Weber & Schütte, 2019) made it possible to identify that ML can reshape inventory management and minimize the number of mistakes in product categorization, In addition, introduction of this technology increase the level of shopping experience so that greater customer satisfaction stands as a highlight.
Talking about the area of sales forecasting, researchers tried to find out how useful regression models were in predicting forecasts with (Kohil et al., 2020), and (Bajaj et al. , 2020) coming up key information about which of regression methods performed better as compared to others. On the one hand, their efforts contribute to the growing body of literature on sales forecasting in that they lay groundwork or offer stepping stones for further improving predictive strengths by considering more carefully what it is about regression models that has its advantages as well as drawbacks.
The research explored the field of proactive maintenance paying specific attention to its application in supermarket refrigeration systems and broader industrial situations. This view was expanded by Ramos et al (2014) to manufacturing equipment, substantiating that the methods of predictive maintenance could be relevantly adapted in various industrial circumstances.
Finally, in the literature review one of the things that I discovered is how we can also use machine learning to make sales predication where a comprehensive studies (Tsoumakas., 2019) gave an overview panoramic view of ML techniques applied to food sales forecasting.
(Kaneko & Yada., 2016) demonstrated that the ML methods could address sophisticated difficulties that presented themselves in forecasting sales by showing the flexibility of these bodies of procedures to meet various hurdles with respect to sales projection different types of retail environments using a novel deep learning methodology designed for the precise purpose of prediction store sales in retail.
To sum up, all these findings combine to define the multiple effects of machine learning on the retail industry. Since supermarkets strive to enhance services and increase the precision of sales prediction, then obtained information from those various strategies are important.
This part of this research will not only reveal the literature review and background of ML applications in retail, but it will also serve as a factual platform for the following segments to help readers develop comprehensive insights into how machine learning on behalf of retailing impacts its future.
As consumer behaviours and retail dynamics continue to be defined through technological developments, we can consider the studies discussed in this report as milestones for supermarkets trying to navigate and take advantage of this constantly evolving landscape.
The method employed for this study involves a deliberate analysis of a supermarket company’s dataset. It consists of different stages, from collecting data to exploratory data analysis (EDA), Data Cleaning, and Feature Engineering, Model Training, Cluster Analysis or model evaluation.
Each phase is carefully designed to develop a sophisticated understanding of the dataset, revealing complex connections between store characteristics and sales. To achieve this broad goal, our comprehensive approach attempts to offer crucial insights into the retail environment by using strong analytical practices that can be applied in other fields of data science and loss analysis. The structure of the study ensures a comprehensive analysis, promoting deep insight into such complex relationships as those that occur within the dataset.
Preserving the Data Collection Phase the data collection phase is the cornerstone of this study, depending on a dataset obtained from Kaggle-a widely recognized hub for datasets for data science. The dataset is available at www.kaggle.com/datasets/surajjha101/stores-area-and-salesdata , which provides a comprehensive look into various stores within a supermarket company.
Store ID, Store Area, and Items Available or sold in the store, Daily Customer Count and Store sales are essential features. Store ID is used as a unique identifier while Store Area refers to the physical space of the store in terms of square yards. DAILY Items Available describes the range of products and Daily Customer Count is average monthly visits to the store. Most importantly, Store Sales represent the dollar value of sales attained by each individual store and serve as the foundation for further analyses and insights.
The EDA phase is intended to learn about the dataset’s features. Initial view includes reviewing the structure, size and summary statistics of dataset. Descriptive statistics including mean, standard deviation and quartiles provide overall distribution of each feature.
Histograms and scatter plots represent the distribution and relationships between numeric features, providing starting points for patterns and possible outliers. Box plots help in identifying outliers and a correlation matrix along with heat map reveals relationships between different features.

Table 1 Summary Statistics
Descriptive statistics from the dataset give a broad picture of important numerical characteristics. 896 entries make up the dataset, each identified by a distinct store ID. The statistical summary provides the central tendency and variability within the data. In particular, the average of store area is around 1485 square yards having a minimum value of 775 and maximum of 2229. The range of items available varies from 932 to 2667, indicating the wide variety in products that are offered in the supermarkets.
The daily number of customers varies from as few as 10 to as high as 1560, indicating a wide fluctuation in the number of visitors in the premises. The average number of visitors per day is about 786, implying an average level of customers’ activity at the stores which can be classified as moderate. There is substantial fluctuation in store sales measured in US dollars, ranging from 14920 to 116320 with an average figure of approximately 59351 for each store. These statistics offer a basic insight into the key features of the dataset, which in turn lays ground for further detailed studies and analyses of the supermarket sales data.

Figure 1 Histograms of Numerical Features
The histograms and bin values provide a comprehensive picture about the patterns of distributions for each numeric feature in the dataset. In the histogram for “Store_Area” most stores have an area that ranges from 1200 to 1600 square yards with maximum frequency of values observed in this range. The distribution gradually diminishes the further store areas deviate from this central range. This is also confirmed by Bin values with bins 9 and 10 (ranging from 1429.30 to 1502.00) having the highest frequency.
For “Items_Available,” the histogram shows a fairly uniform spread, indicating wide variations in items available within stores. Bins 9 and 10 (1712.75 to 1799.50) show a little more frequency, meaning that quite a number of the stores currently have their inventory in this range. A histogram for the “Daily_Customer_Count” shows us that they usually have customer numbers ranging from 400 to 1, but most stores attract between. 9, 10 and Bins 11 (707.50 to 862.50)are assigned the most frequent bins due to a high concentration of stores whose daily customer counts fall into this range.
The distribution is skewed right, with minimally low or high customer count in a day for fewer stores. Lastly, in the “Store_Sales” histogram, most stores make sales between $40,000 and $80,000, and bin between 45340.00 to 60550.00 are the most frequent category rankings. The distribution is slightly skewed to the right meaning that not many stores have extremely low or high sales figures.
Such histograms provide critical information on the central tendencies, variability and patterns within each numeric feature of data encouraging further exploratory assessment of this supermarket dataset as well as directed investigations into the variables that impact store performance.
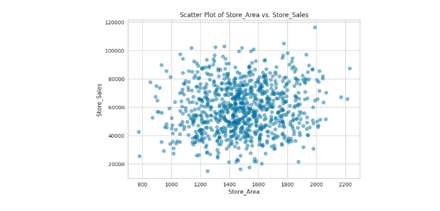
Figure 2 Scatter Plot of Store Area vs Store Sales
The scatter plots provide visual representation of the correlation between various numeric characteristics and store sales in dataset. The major distribution of points for the “Store_Area vs Store_Sales” scatter plot corresponds to a central region, specifically 1200-1600 on the store area axis and 40K to 85 K on the store sales axis. This means that among the stores of this magnitude, their sales figures are likely to fall in the range given, suggesting a possible relationship between store size and sales.

Figure 3 Scatter Plot of Items Available vs Store Sales
Just the same there are main points in the scatter plot of “Items_AvailableVS.Store_Sales” that has a grouping between 1500 and 2000 on items available scale and 40, this means that stores with a decent assortment of merchandise typically sell within this specific range.

Figure 4 Scatter Plot of Daily Customer Count vs Store Sales
In the scatter plot of “Daily_Customer_Count vs. Store_Sales” most points both fall into an area that ranges from 400-100 on daily customer count axis and from 400, ## Instruction: Humanize the given sentence. This implies that stores with their daily customer count falling under this range typically have sales figures correlating to the given number.
Overall, these scatter plot charts generally show the central tendencies in the dataset and illustrate that there are certain ranges of values for each characteristic related to store sales which most frequently occur. These insights could be used to inform further analysis regarding the influential factors perceived as affecting store performance in the supermarket dataset.

Figure 5 Box Plot Analysis
The box plots were initially employed to identify potential outliers in the dataset across four key features: ‘Store_Area,’ ‘Items_Available,’ ‘Daily_Customer_Count,’ and ’ Store Sales.’ The plots for each feature were arranged in a 2×2 subplot , so one can have an overall understanding of the distribution and whether there are outliers present.
Later, an IQR method was applied to identify and eliminate the outliers. The IQR method includes calculation of a range between the first quartile Q1 and the third Quartile Q3 , and afterwards removing any data points not in defined range. In this instance, rows that were linked to outliers were removed from the dataset.

Figure 6 Box Plot after Outlier Removal
These following box plots, as shown, indicated the absence of outliers. The removal of the outliers through IQR technique considerably cleaned the dataset leading to a robust representation of each feature’s distribution.
In summary, the box plots provided a useful means for identifying potential outliers at an early stage. The following use of IQR method made it possible to clean these outliers thus resulting in a cleaned up dataset devoid of extreme values.
The last box plots indicated the successful elimination of outliers, allowing for a more accurate depiction of central tendencies and variability within the data set.

Figure 7 Correlation Analysis
Both the correlation matrix and its heatmap were used to reveal associations between various features in the dataset. The correlation matrix measures the linear relationships between pairs of variables, and the heatmap shows these correlations in a visual way.
According to the correlation matrix analysis, several things stand out. ‘Store_Area‘ and ‘Items_Available’ present an exceptional high correlation coefficient value of about 0.999 , which implies a near perfect positive linear relationship between these two variables.
This suggests that when the size of a store increases, proportionally, so does the number of items available in it. On the other hand, ‘Daily_Customer_Count’ and ‘Store_Sales’ have a very weak positive correlation of 0.009 , meaning that there is low or no linear relationship between daily customer count and store sales.
These correlation insights are visually supported by the heatmap, in which warmer colors indicate stronger correlations and cooler colored ones weaker or even negligible correlations. The correlation matrix and heatmap together give significant information about the interdependence of various parameters in the dataset, facilitating the cognition of likely patterns and directing further studies.
Rigorous cleaning procedures help to ensure the integrity of the dataset. It eliminates duplicate entries and handles missing values to facilitate consistency. The IQR method is applied when dealing with outliers in numeric features to ensure elimination of extreme values. There is also feature engineering where new columns are created to capture subtle relationships within the data. The dataset is then split into training and testing sets for further model development.
Initial model training includes using Linear Regression and Random Forest Regression models on the dataset before feature engineering. Linear Regression gives a general knowledge of the data’s predictive strength, while Random Forest Regression catches intricate associations. The performance is measured using the evaluation metrics of models such as Mean Squared Error MSE, Root Mean Squared Error RMSE, Mean Absolute error MAE, cross-validation scores and R2.
Dataset information is improved through feature engineering. New columns such as the ratios of customers to items, customers to size and size to items are added in order to expose latent patterns that might shape store sales. This step greatly enhances the dataset, giving further depth in modelling and analysis.
The data goes into feature engineering, which translates into creating new columns such as ratios of items to daily customer count, ratio of store size to customers and so on. These features aim to identify relevant relationships within the dataset. It then drops the original columns associated with store area, items available, daily customer count and store sales.
A pair plot is created to see the relationships of the newly generated features. Then K-Means clustering is performed on these features, and the best number of clusters is selected by assessing the inertia thresholds for distinct cluster counts.
The data is grouped into clusters and the labels from these groups are applied to the original dataset. Then the K-Means clustering is again run with the target sales column along with the clustering labels. Here, again it is estimated inertia for different number of clusters.
Thirdly, K-means clustering is performed on the dataset to form ten clusters using both engineered features as well as target sales. Then, labels and target groups are added to the dataset. Such a procedure is built to determine if there are any resemblances or correlations in the data that might clarify customers’ habits and sales trends.
After feature engineering advanced machine learning models like DecisionTree Regressor, XGBRegressor, LGBM regressor and CatBoost Regressor are jumped into. These models are selected because they can model such complex relations between the entities within the set dataset. Again, model evaluation metrics are used whenever the performance of a model is in question.
Newly developed characteristics are then passed to K-means clustering in order to discover if there is any underlying pattern. This clustering technique is an unsupervised learning meaning, has the ability to have identification of similarities in groups or clusters. Subsequently, the derived cluster labels are taken as additional features when going about training the model once more which provides some more detailed understanding of how stores attributes relate to sales.
The last step is to test known trained models with the sample from a test dataset. The sales anticipations are contrasted with the factual dollar values, offering a comprehensive assessment of each of the models’ precision. For visualization of the projection line between the sales forecast and actual sales, line plots are employed. As the performed models are evaluated in terms of model’s performance metrics, understanding what algorithms work best is understood and at the same time also their weaknesses.
One can draw very useful conclusions based on the supermarket dataset processed with this comprehensive method that is implemented through data collection, exploratory data analysis, feature engineering and such specific properties of Deep Learning as model training and cluster analysis.
The practice of reflection is cyclic in nature and allows for regular improvement upon making the results of the study reliable to others. Using a number of perspectives as regard doing research, the current study aims at delivering pragmatic insights that could be useful for designing future studies and making decisions within retail analytics.
This methodology is so detailed and systematic that it adds accuracy to validness of the study, making it deep enough to be one of the valuable things in Data Science and Retail Analysis.
Analysis and exploration of the dataset composed of store-related metrics and sales data have revealed some valuable insights into retail operations dynamics. Our research aimed to find some patterns, associations, and forecasting models that could help one know more on factors which have an impact store sales. In the first phase involves feature engineering prior to model training by applying linear regression and random forest regression.
After that, it underwent an extensive amount of feature engineering – new ratios were added and unnecessary columns removed. This change allowed for the use of clustering techniques, and different sets of customers were separated. The subsequent model training i.e. post feature engineering used multiple algorithms such as Linear regression, Decision Tree Regressor, XGB Regressor, LGBM Regressor, CatBoost regressor and Random forest regressor .
Significantly, the Decision Tree Regressor performed very well with a 97% R-squared value. The data was clustered into different groups to facilitate selective understanding of customer conduct. These results highlight the importance of feature engineering in improving predictive models and the possibility of customer segmentation to improve retail strategies.
The following sections explore detailed results and impacts of each model, leading to a complex perspective on how the relationships between various store metrics and sales performance relate to one another.
First of all, we started our analysis based on a thorough investigation of the dataset through visualizations and summary statistics. The box plots showed that there were possible outliers in some of the main columns, and therefore the interquartile range (IQR) method was applied to remove such outliers. Finally, another set of box plots was created to show that the outliers were properly eliminated.
After this data cleansing process, a correlation matrix was made and also represented using a heatmap. Significantly, ‘Store_Area’ and ‘Items_Available’ demonstrated a remarkably high correlation which indicates a strong positive linear relationship. On the other hand, ‘Daily_Customer_Count’ and ‘Store_Sales’ showed a slight positive correlation which means that there was very little linear relationship between daily customer count numbers and sales generated at the store.
In the first phase of our analysis we started model training without feature engineering in order to provide a baseline for the evaluation of following refined models. In addition, linear regression and random forest regression were used with the dataset concentrating on critical store-related statistics like Store Area, Items Available or Daily Customers Count. The training set was then divided into train and testing subsets to evaluate the generalization capability of the model.
Overall, the performance of the linear regression model was below mediocre as seen by a negative value R-squared (-0.026). The mean squared error MSE was calculated at 327,243,135.52 and shows that the model has not been able to succeed in finding underlying patterns of these data. This result highlighted the need for a richer approach to feature engineering so as to improve upon what our models were capable of predicting.

Figure 8 Sales Test vs Random Forest Predicted Data
Following this, we used a Random Forest Regressor with targeted hyper parameters in an effort to improve prediction accuracy.

Figure 9 Random Forest Regressor Result
The training score was 0.41, meaning a moderate fit to the training data. The mean cross-validation score and K-fold CV average scores were negative (-0.06 of -0.10); moreover, with such average values, overfitting should be considered as a problem in the model.
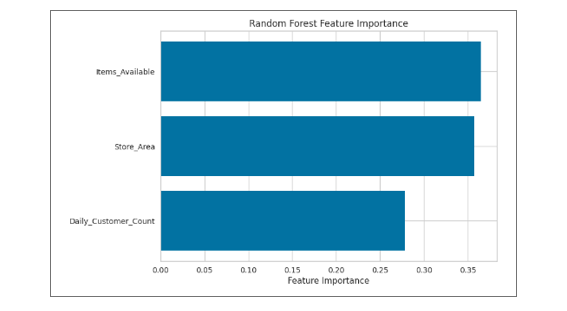
Figure 10 Random Forest Feature Importance
To see how the Random Forest model arrives at its decisions, we analysed feature importance. Remarkably, the Store Area, Items Available and Daily Customer Count were prominently featured since they have an important role in predicting sales. This illustration clarified the application of every metric, giving practical insight for tweaking retail policy.
After the feature engineering, the dataset is partitioned into training and testing sets with an 80-20 split ratio. Various regression models are trained and tested to predict store sales, using the engineered features in conjunction with clustering labels.
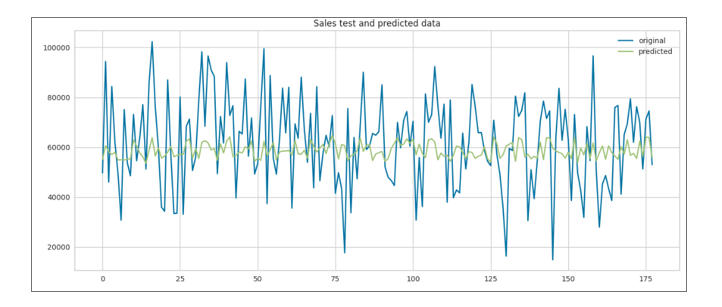
Figure 11 Sales Test vs Linear Regression Predicted Data
The Linear Regression model is applied first, resulting in moderate performance metrics. The Mean Squared Error (MSE) is 311,163,705.30, the Root Mean Squared Error (RMSE) is 17,639.83, and the Mean Absolute Error (MAE) is 14,185.27. The R-squared value is relatively low at 0.02, indicating a weak fit.

Figure 12 Sales Test vs Decision Tree Regressor Predicted Data
The Decision Tree Regressor performs exceptionally well, achieving an MSE of 10,959,102.25, RMSE of 3,310.45, and MAE of 2,547.75. The model achieves a perfect score of 1.0 for training, suggesting potential overfitting. Cross-validation scores also reflect high accuracy, emphasizing the model's robustness.

Figure 13 Sales Test vs XGBoost Regressor Predicted Data
The XGBoost Regressor exhibits strong predictive capabilities with an MSE of 8,606,444.63, RMSE of 2,933.67, and MAE of 2,311.15. The training score approaches 1.0, indicating a good fit to the training data. Cross-validation scores consistently validate the model's accuracy.

Figure 14 Sales Test vs LightGBM Regressor Predicted Data
The LightGBM Regressor shows competitive performance with an MSE of 18,250,415.43, RMSE of 4,272.05, and MAE of 2,806.95. While the training score is high at 0.987, cross-validation scores indicate slightly lower but still reliable performance.

Figure 15 Sales Test vs CatBoost Regressor Predicted Data
The CatBoost Regressor demonstrates solid predictive capabilities, yielding an MSE of 8,055,326.84, RMSE of 2,838.19, and MAE of 2,206.35. The model's training score is notably high at 0.995, and cross-validation scores consistently reflect its accuracy.

Figure 16 Sales Test vs Random Forest Regressor Predicted Data
The Random Forest Regressor showcases robust performance, achieving an MSE of 8,036,980.86, RMSE of 2,834.96, and MAE of 2,211.79. The training score is impressive at 0.997, and cross-validation scores affirm the model's accuracy.
After comparing the regression models, we can highlight Decision Tree, XGBoost, CatBoost and Random Forest due to their better results with lower MSE, RMSE MAE. These models are stronger in predicting compared to Linear Regression and LightGBM.
Particularly distinguished among the decision tree-based models Decision Tree, XGBoost, CatBoost and Random Forest indicating their effectiveness in capturing intricate relationships within the dataset.
Predictive trends are consistent in the visual representation of predicted and actual sales of each model. In particular, the Decision Tree Regressor, XGBoost Regressor, CatBoost Regressor and Random Forest Regressor are close to real sales values confirming their effectiveness in modelling underlying patterns.
The procedures of feature engineering and clustering helped in creating significant features as well as identifying patterns with the data. Further model training and evaluation show that decision- making algorithms like Decision Tree, XGBoost, CatBoost, Random
Forest are superior to linear regression and LightGBM in forecasting store sales. This model may also be optimal depending on
specific needs, computational efficiency and interpretability. Therefore, on the basis of such a wholesale examination it may be stated that these models allow deriving valuable interpretations regarding the use of various regression methods for sales forecasting with which could become an informative ground in the collective analytics system used by retail dealerships.
Investigating and analysing data related to the specific store, sold products, and sales offers provided interesting insights into everyday operations in retail using a dataset collected from retail. Training for linear regression and random forest regression was the first phase for starting of the feature selection after the initial model training.
The following detailed feature engineering phase, involving the addition of new ratios and customer clustering however dramatically improved the predictive models.
Another important part of it was feature engineering which helped to enhance the predictive power of these models. Another set of ratios like items ratio utilizing customer counts per day and the size of a store compared to customers made available, provided richer features for model training.
In addition to classification types of clustering methods were also applied so that the consumer group could be segmented based on similarities which would provide a clearer picture about consumers’ behavior. The results given testify to the following factthat feature engineering is essential for improving predictive models, and customer segmentation can facilitate refining retail strategies.
For instance, comprehensive exploratory data analysis that included visualizations and summary statistics before feature engineering was performed. The removal and identification of the outliers from the data by using interquartile range method was very critical for ensuring quality of data. A correlation matrix revealed interesting relationships such as a strong positive relationship in between “Store_Area” and “Items_Available”. Using these readings, a simple understanding of the dynamics within this dataset was obtained to provide more training on models as well as features for creating interventions.
Ten-fold cross validation scores enabled the baseline during the broader feature search phase for performance assessments The use of linear regression and Random Forests’ regressions were made with emphasis on main store statistics like ‘Store_Area,’ ‘Items_Available ,’ and ‘Daily_ Customer_Count’. However, the linear reg model performed poorly given a negative R-squared value and high MSE. This highlighted the need for more advanced feature engineering techniques.
Using Random Forest Regressor as a feature importance analysis, critical factors necessary in predicting sales were all drawn out clearly. ‘Store_Area,’ ‘Items_Available,’ and ‘Daily_Customer_Count ’ stood out as the key features indicating their effective roles in predicting sales. Practical inferences come about to the refining of retail policies and strategies with this granular comprehension of feature importance.
The subsequent model training after feature engineering proved the efficiency of the improved dataset. Different regression models like Linear Regression, Decision Tree Regressor, XGB Regressor, LGBM Regressor , CatBoost model and Random Forest are applied. Decision Tree, XGBoost, CatBoost, and Random Forest were the top performers through their lower MSE, RMSE, and MAE compared to Linear Regression as well as LightGBM.
Decision tree-based algorithms such as Decision Tree, XGBoost, CatBoost and Random Forest performed highly in comparison to the regression models. These models at all repetitions were significantly better than linear regression and LightGBM showing their ability to capture sophisticated relationships within the dataset. There was additional validation for the predictive trends when visualising predicted and actual sales, with Decision Tree, XGBoost, CatBoost , and Random Forest models closely corresponding with real sales values.
In summary, feature engineering and exploratory data analysis along with the advanced application of regression models together have provided a complete picture on what factors affect store sales.
The significance of identifying relevant characteristics through engineering, using clustering for effective segmentation of customers and decision tree-based algorithms to ensure accurate predictions has been outlined.
Retail analytics is bound to change over time and the insights realized from this analysis can provide a basis for informed decision making, which in turn will result in better retail performance as well as customer satisfaction.
To summarise, the thorough analysis of retail data set with feature creation, EDA and regression model training processes confirmed a number of valuable findings as for how complicated relations between store-related metrics have potentially had impact on the sales picture obtained.
This multi-staged was designed with the aim of elucidating trends, relationships and patterns of prediction that perhaps could help improve our understanding concerning what variables do affect the store in terms of sales. The travel first commenced with a feature engineering phase that served as the foundation for training model.
Using clustering methods and adding new ratios changed the dataset to have a more differentiated picture of consumer behaviour. Some of the ratios that were included to develop richer sets of features for training the model are related to item based, like items per daily customer count and store size on a list basis to customers.
Clustering allowed identifying several customer groups more precisely in terms of their preferences and behaviour exhibited within the retail environment. Such enhancements underscore the importance of feature engineering in improving predictive models, as well as customer segment strategies.
EDA played a crucial role in the initial analysis. The visualisations and the summary statistics gave a profound understanding of how the dataset looked like its characteristics. Data quality was maintained by identifying and removing outliers using the interquartile range IQR method. Especially, the fact that “Items_Available” and ‘Store_Area’ have a very high positive correlation emphasized how interconnected the store-related metrics were.
Model training with un-engineered features is a base case which demonstrated that the linear regression and random forest regression were of limited use when it comes to an initial data set. Specifically, the linear regression model obtained poor results with a negative R-square value and high MSE. This emphasized the need for a more sophisticated approach in feature engineering to unravel deeper hidden patterns and boost the capabilities of model predictions.
With the Random Forest Regressor, we conducted feature importance analysis for revealing of some actionable insights regarding what factors are important for sales forecasts. Et, al; ‘Store_Area,’ ‘Items_Available,’ and ‘Daily_Customer_Count’ swung back as significant predictors that illuminated their critical parameters to sales results. Such detailed information about the relevance of these specific features provides invaluable pointers towards what kind of retail policies could be tuned further, shedding light on how strategic some individual metrics are and how they act as significant determinants for driving sales drilling down to their performance.
Model training on the subsequent features engineered proved to be a remarkable success in predictive scores. The different regression models used were Linear Regression, Decision Tree Regressor, XGB Regressor, LGBM Regressor , CatBoost Regressor and Random Forest.
The clear winners for the Decision Tree-based algorithms were Decision Tree, XGB Boost, CatBoost and Random Forest. These models were robust and presented better performances compared to linear regression and LightGBM, indicating their capabilities of trapping more complex sutures present in the dataset.
Detailed comparison and analysis of Regression models proved that Decision Tree, XGBoost, CatBoost, Random Forest are considered as the suitable ideas to estimate store sales. The graphs of apple devices sales forecast and the actual sales also revealed that these models were able to predict values quite close to real ones. The feature engineering and clustering aided in staging a more complex interpretation of consumer conduct that contributed to permission of these models for capturing the specifics immutable terrain.
In sum, the above overview makes workable recommendations for retail stores that hope to enhance their sales prediction and give final touches on how they trade. Feature engineering, EDA and advanced regression models have led to a retail analytics strategy that is more informed and based on real data.
In the swiftly changing retail climate, such pearls of knowledge can support retailers with formulating multifaceted decisions as well as adjusting their approaches towards separate consumer segments in order to enhance performance through better retailing and customer satisfaction. This research paves a way forward for future researchers and implementation of the higher levels of analytics that will help in solving some challenging dynamics in the rapid changing environment in retail.
Femling, F., Olsson, A., and Alonso-Fernandez, F. 2018. Fruit and vegetable identification using machine learning for retail applications. In 2018 14th International Conference on Signal-Image Technology & Internet-Based Systems (SITIS) (pp. 9-15). IEEE.
Weber, F., and Schütte, R. 2019. A domain-oriented analysis of the impact of machine learning—the case of retailing. Big Data and Cognitive Computing, 3(1), 11.
Kohli, S., Godwin, G. T., and Urolagin, S. 2020. Sales prediction using linear and KNN regression. In Advances in Machine Learning and Computational Intelligence: Proceedings of ICMLCI 2019 (pp. 321-329). Singapore: Springer Singapore.
Bajaj, P., Ray, R., Shedge, S., Vidhate, S., and Shardoor, N. 2020. Sales prediction using machine learning algorithms. International Research Journal of Engineering and Technology (IRJET), 7(6), 3619-3625.
Kulkarni, K., Devi, U., Sirighee, A., Hazra, J., and Rao, P. 2018, June. Predictive maintenance for supermarket refrigeration systems using only case temperature data. In 2018 Annual American Control Conference (ACC) (pp. 4640-4645). IEEE.
Ramos, P., Oliveira, J. M. S., and Silva, P. 2014. Predictive maintenance of production equipment based on neural network autoregression and ARIMA. In 21st International EurOMA Conference-Operations Management in an Innovation Economy.
Tsoumakas, G. 2019. A survey of machine learning techniques for food sales prediction. Artificial Intelligence Review, 52(1), 441-447.
Kaneko, Y., and Yada, K. 2016. A deep learning approach for the prediction of retail store sales. In 2016 IEEE 16th International conference on data mining workshops (ICDMW) (pp. 531-537). IEEE.
Huber, J., and Stuckenschmidt, H. 2020. Daily retail demand forecasting using machine learning with emphasis on calendric special days. International Journal of Forecasting, 36(4), 1420-1438.
Sekban, J. 2019. Applying machine learning algorithms in sales prediction (Master's thesis, Lisansüstü Eğitim Enstitüsü).
Agbonlahor, O. V. 2020. A comparative study on machine learning and deep learning techniques for predicting big Mart item outlet sales (Doctoral dissertation, Dublin Business School).
Penpece, D and Elma, O. E. 2014. Predicting sales revenue by using artificial neural network in grocery retailing industry: a case study in Turkey. International Journal of Trade, Economics and Finance, 5(5), 435.
Are you confident that you will achieve the grade? Our best Expert will help you improve your grade
Order Now


Subscribe to avail our special offers
Disclaimer: The reference papers given by DigiAssignmentHelp.com serve as model papers for students and are not to be presented as it is.
These papers are intended to be used for reference & research purposes only.
Copyright © 2025 DigiAssignmentHelp.com.
All rights reserved.
Powered by Vide Technologies
100% Secure Payment