$20 Bonus + 25% OFF CLAIM OFFER
Place Your Order With Us Today And Go Stress-Free
The main focus of the assessment is to review the financial performance of Kingfisher Plc and Travis Perkins Plc so that appropriate recommendations can be provided to a client. For the purpose of assessing the financial performance, the analysis computes some of the key financial ratios which are applicable to the business.
The report computes profitability ratios, liquidity ratios and efficiency ratios for both companies so that appropriate comparisons can be made. The analysis would further identify some of the relevant industry trends and non-financial ratios so that appropriate decision can be made on the behalf of the client.
The analysis undertakes a comparative analysis of the business of Kingfisher Plc and Travis Perkins Plc by reviewing the annual reports of the company. The report would compute some of the key financial ratios that are applicable to the business so that an assessment of its performance can be made.
For the purpose of making decisions regarding the financial viability between the two firms, non-financial aspects such as industry trends and sustainability criteria would also be referred to. The analysis further undertakes a SWOT and Porter’s five forces analysis for establishing the competitive forces in the industry and identifying key threats and opportunities which are applicable to both companies.
The report will conclude with recommendations for the client in terms of which company is suitable for a long-term alliance and which company has a better future in terms of profitability, liquidity and efficiency.
The business of Kingfisher Plc provides home improvement solutions for consumers and provides expert opinions for consumers through the e-commerce model. The company is recognized as a British Multinational company which has over 2000 stores globally and is supported by more than 80,000 employees.
The business has successfully expanded its operations over the years and is looking to expand to different countries so that global domination can be achieved in the home improvement industry (Results, reports and presentations - kingfisher corporate. 2023). In the same manner, Travis Perkins Plc also operates in the Home Improvement market, where they are known to provide innovative solutions to people and even construction companies so that better communities can be developed.
In order to assess the external and internal environment for the home improvement Industry, a SWOT framework is applied, which can be related to both companies.
Strengths Some of the key players which are involved in the industry have established their brand name in the market like Kingfisher and Travis Perkins Plc. The brand name established acts as a point of advantage for such firms as they can attract customers on the basis of the same.
Further, it has been a trend in the home improvement industry that companies tend to engage in heavy marketing so that more customers can be attracted. Therefore, high marketing budget maintained by some of the top players adds to their advantage.
Weaknesses The capital requirement which is essential to maintain such a business is huge and this can have severe effect on the liquidity of the business. Companies like Kingfisher Plc implement margin measures so that the liquidity levels can be controlled.
Another weakness for the companies engaged in this industry is that the high cost of operations forces the businesses to set higher prices, and this can discourage customers and affect the sales level.
Opportunities The diversity in the product range that can be offered to the customers can enhance the opportunities. of companies engaged in such an industry. The business of Kingfisher ensures that different variety of products are on offer so that appropriate revenue can be generated from different types of products.
In addition to this, there are opportunities for the business to expand its operations on a global basis so that more revenue is generated from operations. This opportunity also opens door for acquiring more market share and ensuring that a global brand name is created for the business.
Threat The main threat faced in the home improvement industry is the high level of competition, which can have a severe effect on the revenue generation for the companies. With the increase in the competitor, the market share would also be divided and this would affect the operational flow of the companies.
Further there is another major threat which is the rate of inflation which is applicable in the nation and this has a direct effect on increasing the cost of operations for the companies.
In order to better assess the level of competition in the market, the analysis further applies Porter’s Five forces Model and the same is explained below:
Bargaining Power of the Consumers: The bargaining power of the consumers are high considering the fact that they have numerous options available to them for home improvement solutions. It would therefore be the role of the companies to ensure that the products which are offered to the consumers are differentiated so that more customers can be attracted to the business (Thompson and McLarney 2017).
Bargaining Power of the Suppliers: The bargaining power of the suppliers would be low for Home Improvement businesses as there are numerous suppliers and most of the establish companies have their own suppliers. Th suppliers directly have an effect on the cost of operations if they charge higher values and therefore bargaining power of the suppliers needs to be considered before taking appropriate decision related to the same.
Threat of New Entrants: The threat of new entrants would be low for the business as there are barriers to entry in the market which would affect the new entrant’s entry. Further there is a requirement of huge capital which is a difficult aspect for a new business to acquire or maintain.
Threat of Substitute Products: There is a threat of substitute products, which is comparatively quite low in the market. There are small businesses that are established in the market that can also provide home improvement solutions, but these are not very reliable when it comes to quality of service. This is one of the reasons that big brand companies are preferred by consumers.
High Level of Competition in the market. There is a high level of competition in the market for home improvements, and this has a serious impact on the profitability of the companies operating in the industry (Thomas and Rabiyathul Basariya 2019). The level of competition in the market needs to be considered on a priority basis before taking any decision regarding the progress or advancement of the operations.
The financial performance of the businesses can be assessed by considering the annual reports of the business and computing some key financial ratios for the business. The most recent annual reports for both companies are considered so that the current data set can be used for making decisions regarding financial viability.
Further, in order to establish a trend, five years of financial information are considered from the annual report, and this would also help establish a trend in the performance (Atrill 2017). Some of the key categories of ratios, which are computed, cover profitability ratios, liquidity ratios and efficiency ratios. The analysis for the three categories of ratios is portrayed below in an appropriate manner.
Also Read - Business Development Assignment Help
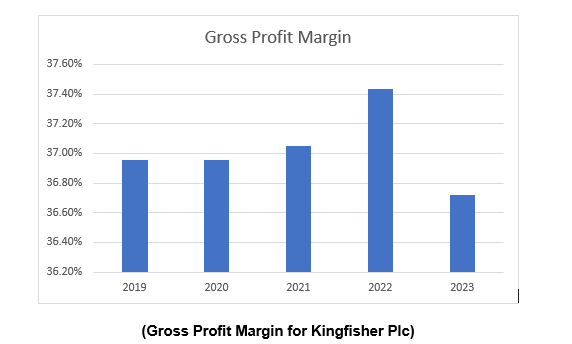
The first category of ratios which are computed is the profitability ratio which covers the gross profit margin and net profit margin. The gross profit margin which is computed for the business of Kingfisher Plc is shown to be 36.72% in 2023 and this has slightly deteriorated from last year’s estimate pf 37.43%.
Further considering a five-year trend, it is clear that the business has consistently maintained its gross profit margin at the same level, which shows the management has appropriate control over its costs and revenue cycles. The analysis further shows that sales revenue for the business has systematically increased over the years but so has the direct costs attributable to sales (Brewer, Garrison and Noreen 2022). This is one of the reasons that the gross profit margin has been stable at the same percentage over the last five years.
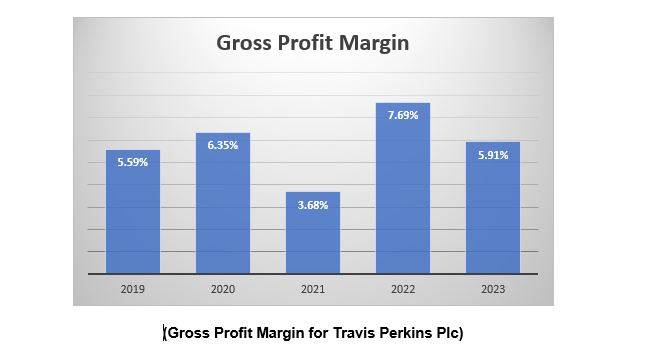
In the same manner, the gross profit margin, which is computed for Travis Perkins Plc, is shown to be 5.91% in 2023, and this estimate was 7.69% in 2022. In comparison to Kingfisher Plc, the gross margin for the company is quite low which shows that the performance of the former is better.
One of the reasons for the lower gross profit margin is the decline in sales, which can be identified from the five-year trend, which has definitely affected the profitability of the business (Results, reports and presentations 2023). The analysis therefore shows that the Gross Profit Margin for Kingfisher Plc is better.
The net profit margin shows the ability to generate net profits in comparison to the sales revenue that the business generates. The net profit margin for Kingfisher plc is shown to be 3.61% in 2023, and this estimate has declined from the previous period estimate of 6.39%. The net profit margin for Kingfisher Plc has improved in 2020 and 2021, which shows that the business is looking to achieve growth in operations (Dibb et al. 2019). The decline in net profit margin for Kingfisher Plc can directly be attributed to hike in cost of operations.
The net profit margin for Travis Perkins Plc is shown to be 3.85% in 2023 and this estimate has also declined for the company from 2022. In terms of five years trend, it can be seen that the business has incurred losses in 2019 and 2021 which is also a result of higher cost of operations. The appendix section further shows that the sales revenue for Travis Perkins Plc has also declined on a consistent basis over the five years which is also one of the reasons for lower Net Profit Margin.
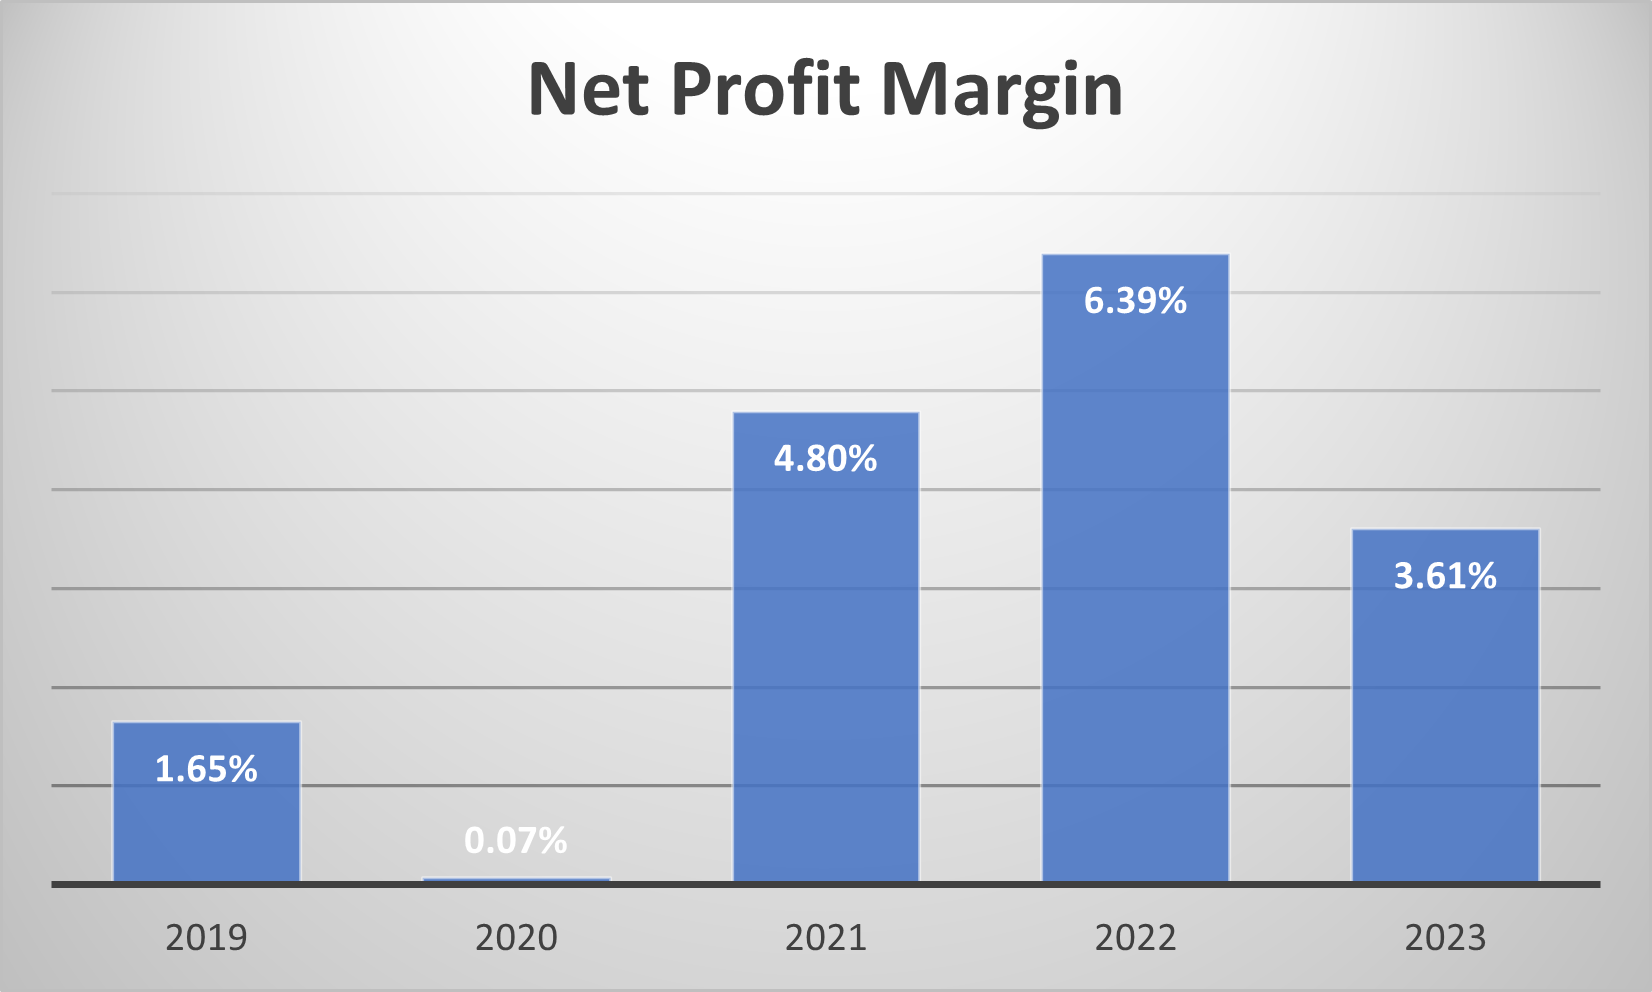
(Net Profit Margin for Kingfisher Plc)

(Net Profit Margin for Travis Perkins Plc)
The current ratio forms part of the liquidity ratios and is an important indicator when assessing the ability of the business to finance big projects or even meet day-to-day expenses for the business. The current ratio for Kingfisher Plc is shown to be 1.30 in 2023 and this estimate has improved from previous period.
A consideration of the five-year trend shows that the management has consistently maintained its liquidity status and, thereby, is in a strong position to undertake any opportunities that come its way and further finance day-to-day expenses (Fridson and Alvarez 2022).
The liquidity ratio for Travis Perkins Plc shows that the current ratio has improved in 2023 and the estimate is shown to be 0.82. The liquidity position has improved for Travis Perkins Plc in 2023 which is a clear sign that the management is looking to make improvements in its working capital so that financing capabilities of the business can be enhanced.
However, the current ratio for Kingfisher Plc is better than Travis Perkins Plc which gives an advantage to the former company.

(Current Ratio for Kingfisher Plc)
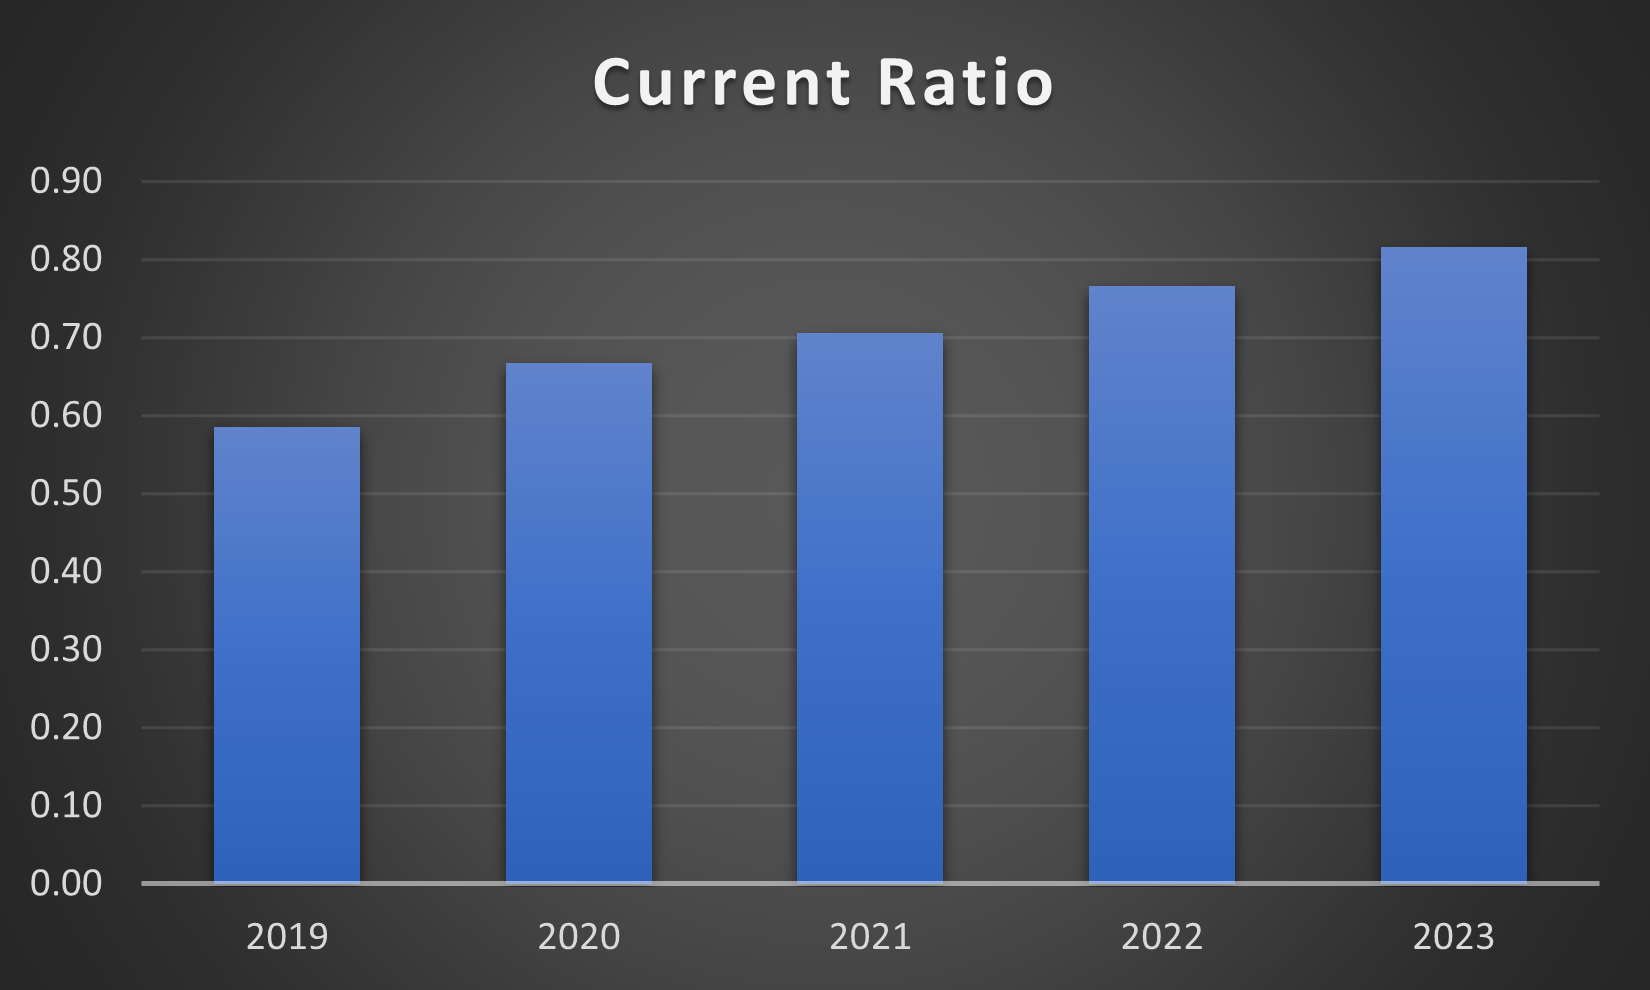
(Current Ratio for Travis Perkins Plc)
The quick ratio for Kingfisher Plc is show to be 0.24 in 2023 which has slightly declined from previous period. The estimate makes it clear that inventories form a major part of the current assets. The quick ratio for the business shows the ability of the business to finance its immediate expenses or urgent obligations. In the same manner, the quick ratio which is computed for Travis Perkins Plc is shown to be 0.52 which is better than Kingfisher Plc.
The quick ratio which is better for Travis Perkins shows that the business has the ability to manage its immediate expenses in a better manner so that efficiency can be maintained (Higgins 2016). In an overall basis, it can be said that liquidity position for the business of Kingfisher is better and can help in meeting all opportunities which comes to the business.
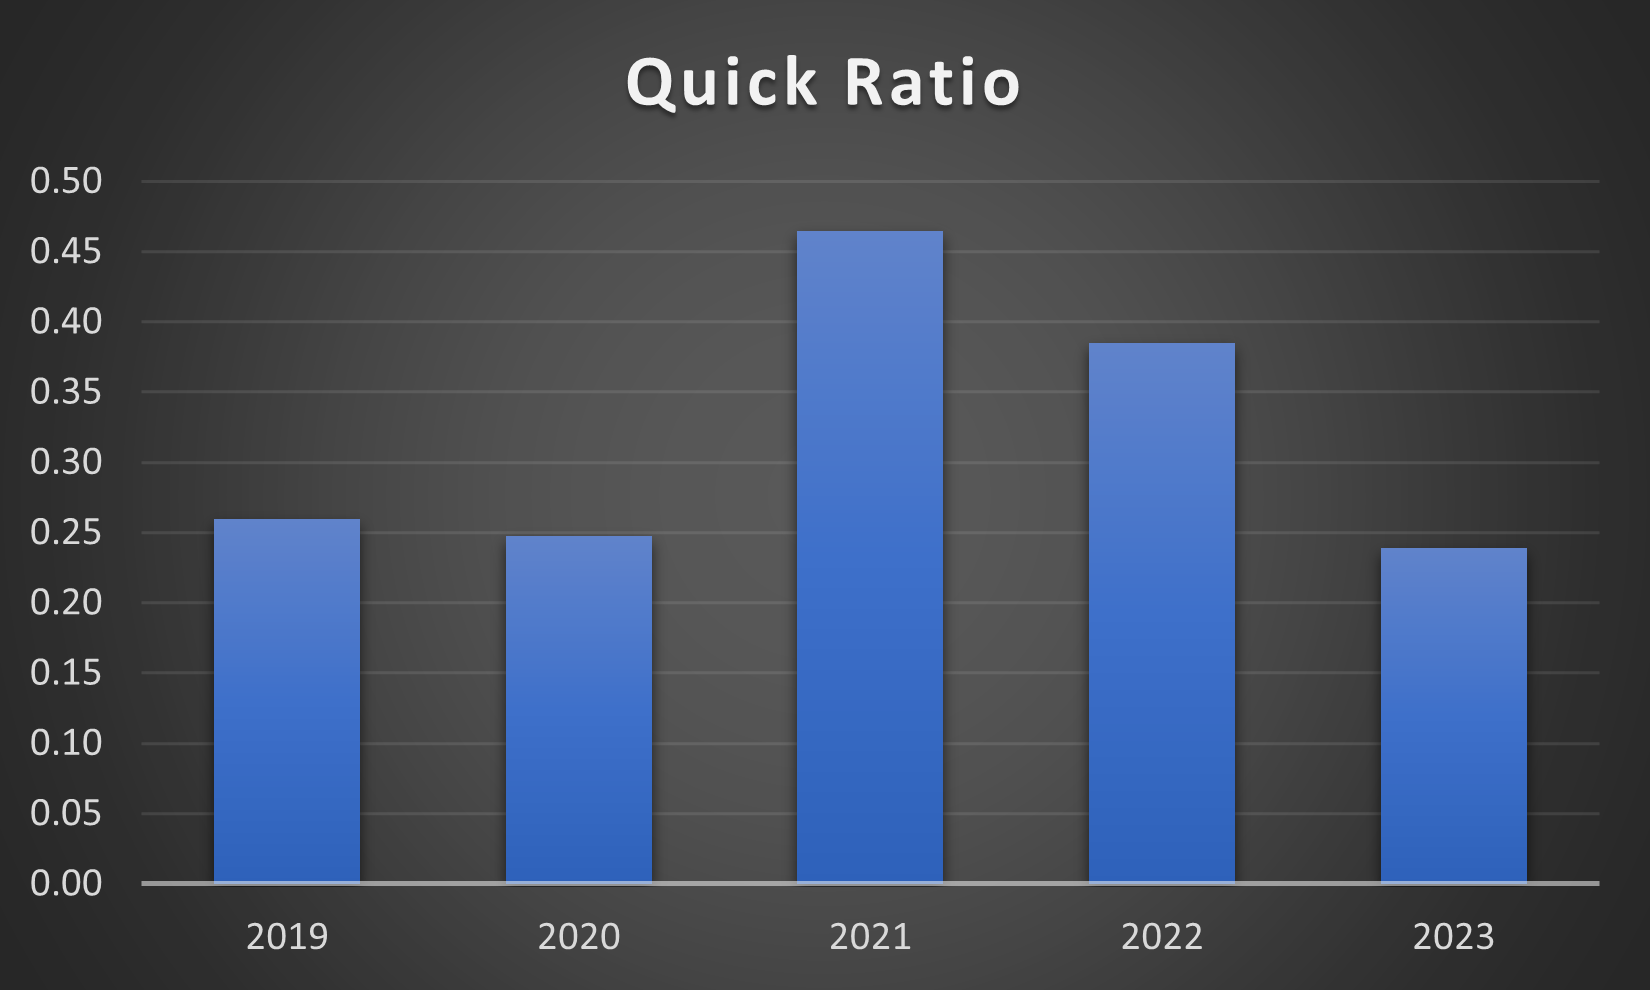
(Quick Ratio for Kingfisher Plc)
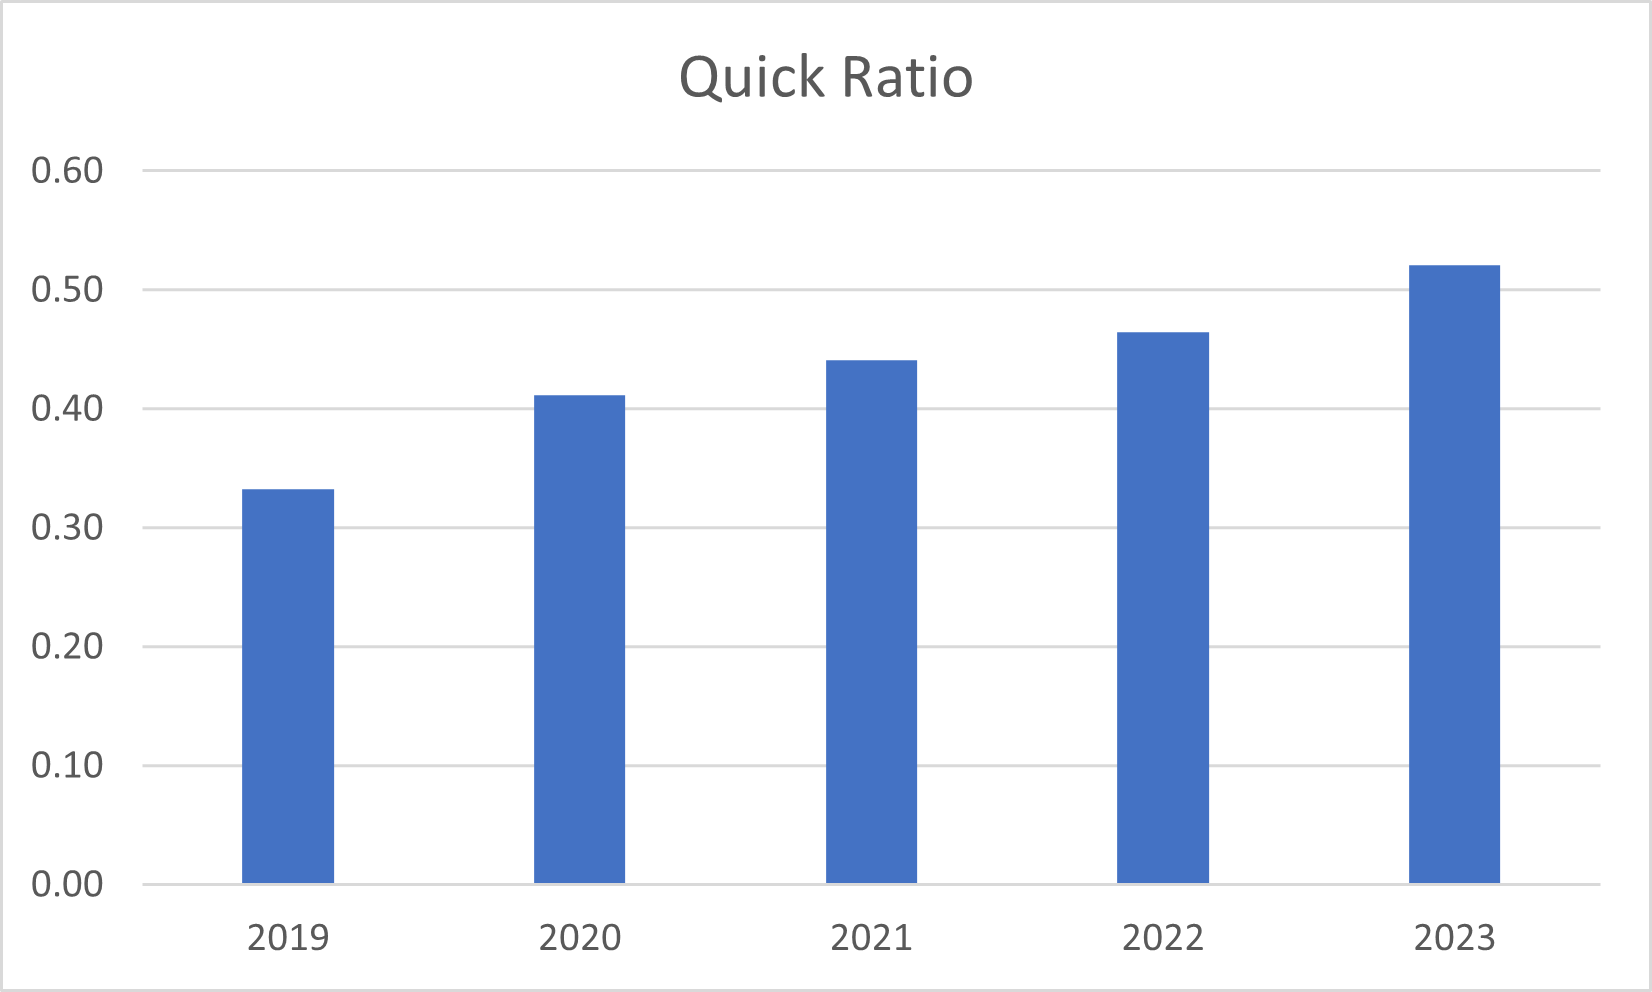
(Quick Ratio for Travis Perkins Plc)
The return on asset estimate appropriately shows how well the management is able to utilize its assets and generate profits from operations. The estimates measure the ability of the business to generate higher margin of profits from the use of its assets. The return on assets for Kingfisher Plc is shown to be 3.89%, which has slightly fallen from previous years' estimates.
The decline is mainly due to the lower profits which the business generated in 2023. Over a five-year trend, it can be established that the management of Kingfisher has utilized its assets in an appropriate manner. The estimate is being considered to be improved further in the coming future.
In the same manner, the return on assets for Travis Perkins Plc shows an estimate of 3.76% which is close to the estimate achieved by Kingfisher plc. However, a close comparison shows that the five year trend of Kingfisher plc is better than Travis Perkins Plc as the former business has been more consistent in its profitability. A graph is presented below which shows the comparison between the two companies and thereby cam be used for establishing the efficiency situation between the two companies.

(Return on Assets for Kingfisher Plc)
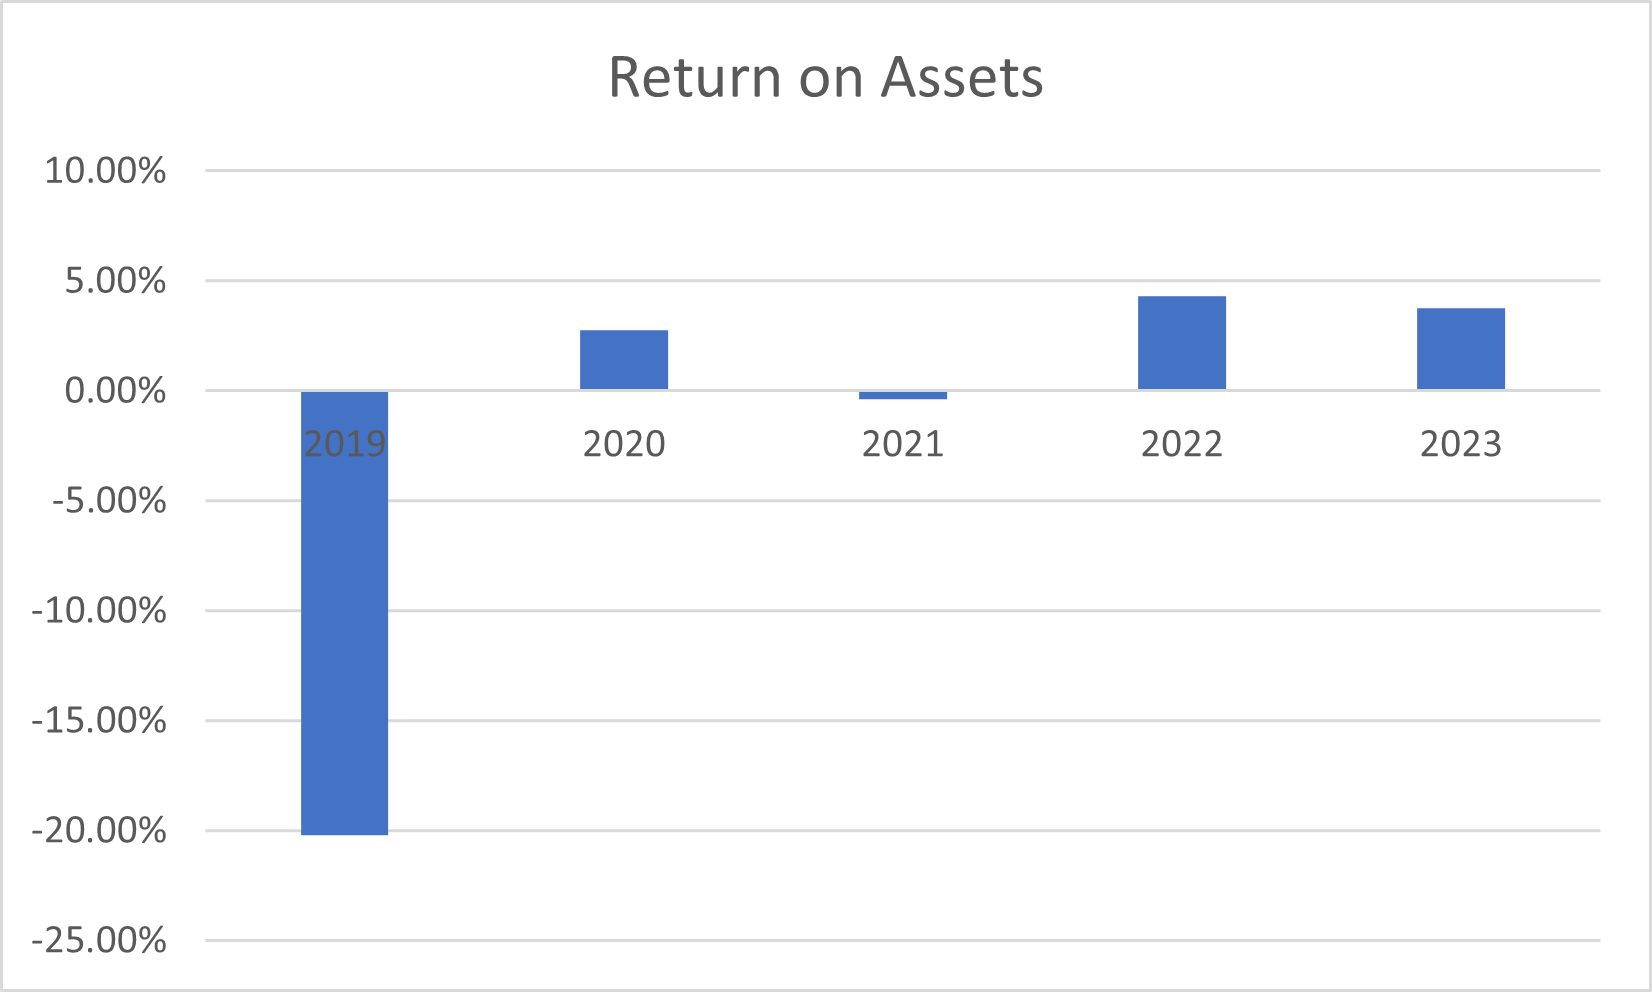
(Return on Assets for Travis Perkins Plc)
The return on equity estimate appropriately shows how well the management is able to utilize the equity accumulated from shareholders. In a decisive manner so that the profitability of the business can be enhanced. The return on equity for Kingfisher Plc is shown to be 7.07%, which has significantly improved in 2023 in comparison to previous years, which is a clear indicator that the business is meeting the expectations of the investors.
The analysis of the return in equity for Travis Perkins Plc shows that the estimate for 2023 is 7.07% which is similar to Kingfisher plc (Wahlen, Baginski and Bradshaw 2018). This shows that both companies consider the expectations of the investors as a priority area and takes every step so that appropriate return can be provided to them.

(Return on Equity for Kingfisher Plc)
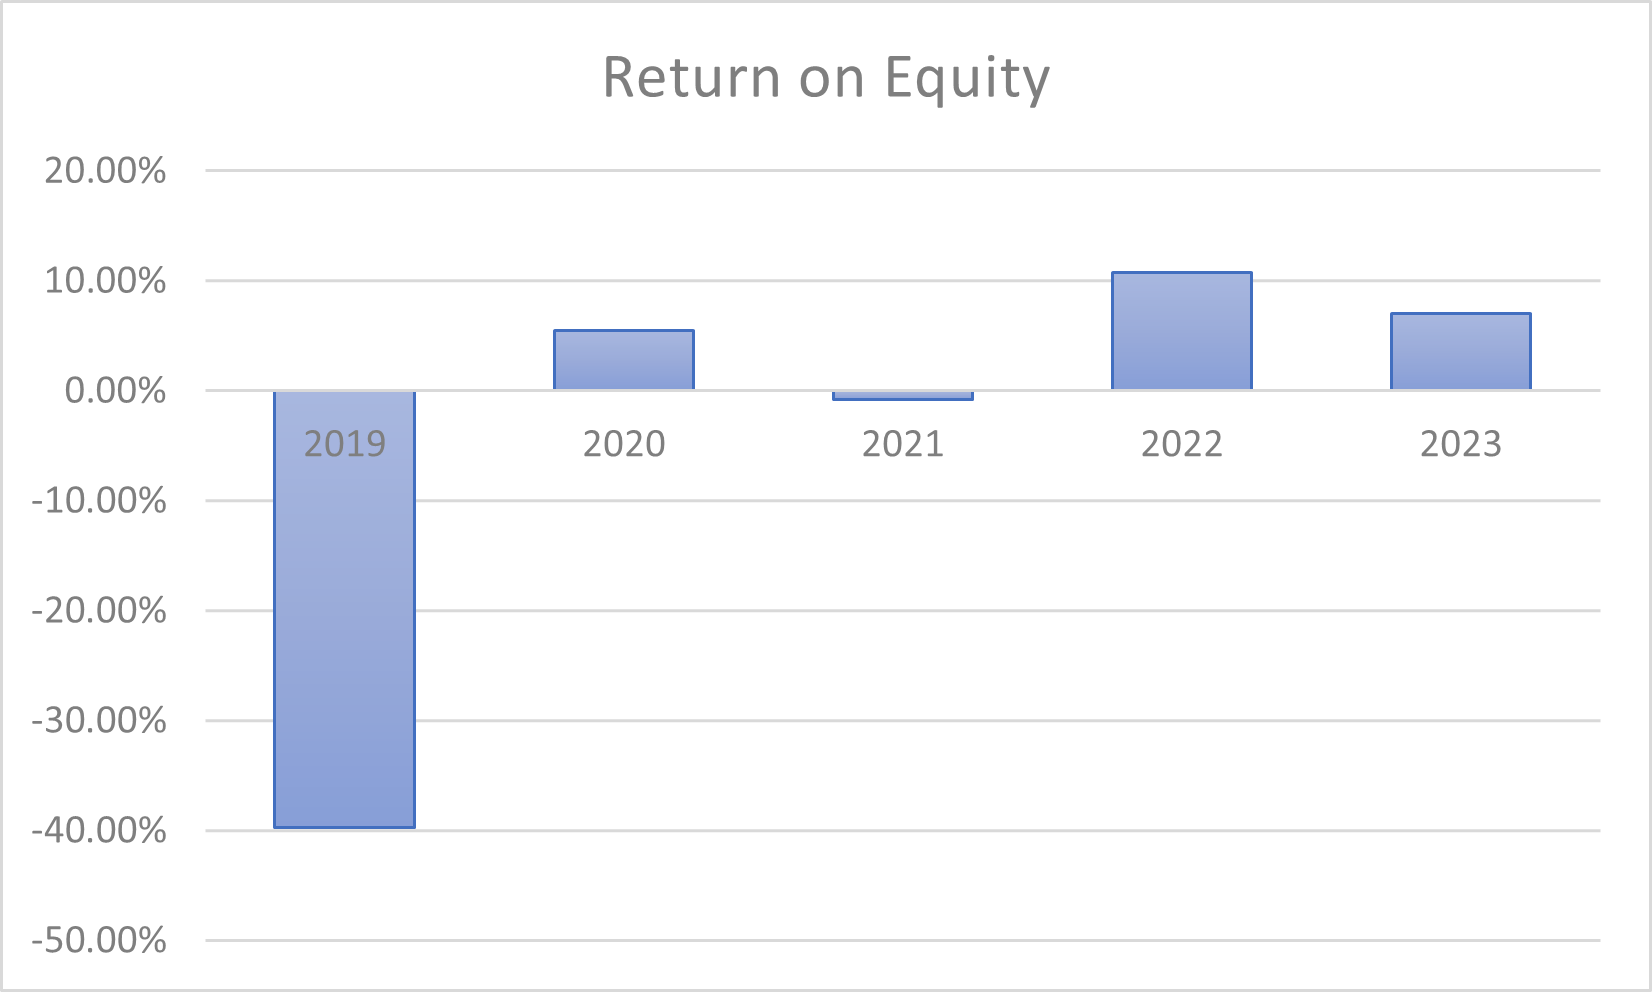
(Return on Equity for Travis Perkins Plc)
On the basis of financial analysis undertaken for both companies, it can be established that the financial performance of Kingfisher Plc is better, and it is a more viable choice for consideration between the two companies. Further there are certain non-financial factors as well such as the level of sustainability in the operations and the contributions which the companies make towards the development of the community at large. The management of Kingfisher has more involvement with the community and the people which makes the business a viable option and therefore the client should consider the same.
The analysis which is presented above appropriately shows that the financial performance for the business of Kingfisher Plc is better than that of Travis Perkins Plc. This is clearly established in the key financial ratios which are computed for the business and the trend which is considered for a five-year period for the company. Further, the analysis shows some of the key industrial trends for the Home Improvement Industry that should be considered when making any decision by the client.
Moreover, on the basis of the non-financial factors as well, the performance of Kingfisher Plc is superior as the business is more involved with the community and takes all the steps to ensure that its development is achieved. On the basis of the financial analysis undertaken, it can be said that the business of Kingfisher is the right choice for the client and thereby the same should be considered.
Allad, I.D.R.I.S.H. and Maisuria, D.M.H., 2015. Ratio Analysis’ an Accounting Technique of Analysis and Interpretation of Financial Statements. International Journal of Research in Humanities & Social Sciences, 3(2), pp.50-54.
https://www.raijmr.com/ijrhs/wp-content/uploads/2017/11/IJRHS_2015_vol03_issue_02_11.pdf
Atrill, P., 2017. Financial management for decision makers. Pearson
https://thuvienso.hoasen.edu.vn/handle/123456789/11800
Brewer, P.C., Garrison, R.H. and Noreen, E.W., 2022. Introduction to managerial accounting. McGraw-Hill.
https://thuvienso.hoasen.edu.vn/handle/123456789/12196
Dibb, S., Simkin, L., Pride, W.M. and Ferrell, O.C., 2019. Marketing: Concepts and strategies. Cengage Learning EMEA.
https://thuvienso.hoasen.edu.vn/bitstream/handle/123456789/13247/Contents.pdf?sequence=1&isAllowed=y
Fridson, M.S. and Alvarez, F., 2022. Financial statement analysis: a practitioner's guide. John Wiley & Sons.
Higgins, R.C., 2016. Analysis for financial management. McGraw-Hill.
https://thuvienso.hoasen.edu.vn/bitstream/handle/123456789/11605/Contents.pdf?sequence=1
Results, reports and presentations - kingfisher corporate. (2023) Available at: https://www.kingfisher.com/en/investors/results-presentations.html
Results, reports and presentations (2023) Results, Reports and Presentations - Travis Perkins | Travis Perkins. Available at: https://www.travisperkinsplc.co.uk/investors/results-reports-and-presentations/
West, D.C., Ford, J.B. and Ibrahim, E., 2015. Strategic marketing: creating competitive advantage. Oxford University Press, USA.
https://books.google.co.in/books?hl=en&lr=&id=CpueBwAAQBAJ&oi=fnd&pg=PP1&dq=West,+D.C.,+Ford,+J.B.+and+Ibrahim,+E.,+2015.
+Strategic+marketing:+creating+competitive+advantage.+Oxford+University+Press,
+USA.&ots=Ds7gIBoWNe&sig
=xejLg0-F0nYhXr5j2maD4nxKvv4&redir_esc=y#v=onepage&q&f=false
The main focus of the analysis is to review the operations of Next Plc which is engaged in clothing and footwear business in the UK. The analysis particularly focuses on the positioning of the business in the market and also makes comparisons with some of its close competitors like Zara and H&M. The analysis would be further portraying the profitability matrix and examine the position where the business stands on the matrix. The case further shows different investments made by the management over the years in its operational divisions so that it can improve further. These investments are reviewed from the risks point of view and also measures are suggested as to how further improvements can be achieved and risks can be minimized.
The main focus of the assessment is to review the operations of Next Plc, which is one of the established clothing, footwear, and accessories brands in the UK. The analysis would focus on the current positioning of Next Plc in the Profitability/Growth Matrix. In order to make comparisons, the analysis would consider some of the competitors that are close to Next Plc.
In addition to this, the analysis would also look into one of the investments made by Next Plc and assess the viability of the investment by applying an investment appraisal approach. The analysis would identify some of the key risks associated with the project and the expected outcome for the project (Next PLC 2023). On an overall basis, it can be said that the analysis would cover recommendations for Next Plc so that the management can improve its operational efficiency further.
The analysis undertakes an assessment regarding the positioning of Next Plc in the profitability Matrix so that better estimation can be made regarding the current situation of the company. The positioning strategies refers to aspect as to how well the business is established in the market and whether the business is in the position to take advantage of the opportunities and generate higher profits. A matrix is presented below which shows the general fronts where a business can be positioned.
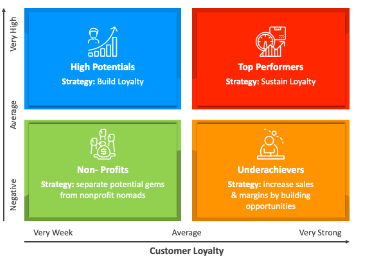
On the basis of above chart, it can be said that the business of Next Plc has high potential as the business has successfully expanded it operations across the UK and hase looked to expand its operations of the global level. This shows that the management has been taking systematic steps to ensure that a loyal customer base is developed which the business can tap into when generating revenue.
This would also be the means for the company to establish its own market and capture as much shares as possible. In this context, a comparison can be made with Zara and H&M, which are also established fashion brands with worldwide recognition and are competitors for the business of Next Plc.
Both Zara and H&M can be positioned as Top performers, which means that the company have a high profitability and has inspired loyalty among the consumers and therefore, both the companies are looking to ensure that the loyalty is sustained (West, Ford and Ibrahim 2015). The analysis makes it clear that the business of Next needs to work more on its customer engagement to create appropriate brand loyalty. Therefore, it can be said that the management of Next Plc needs to make improvements in its operations and even products so that more customers can be attracted and appropriate revenue is generated.
The management of Next Plc has been looking to integrate technology with its existing processes so that some advantage can be developed and a level of differentiation can be achieved. For instances, the management of Next Plc has been making capital investments in developing its warehouses which are fully automated and improving its online website software so that e-commerce operations can be undertaken in an easier manner. Further efforts are being made to improve the supply chain operations for the company so that the business is able to reach more customers (Wild, Shaw and Chiappetta 2018).
One of the improvements that was suggested is to expand its operations to different regions and enhance the capacity at which the business is operating. The advancement of warehouses, e-commerce software, and supply chain infrastructure would contribute to the goal of achieving a higher market share. The investment is being undertaken in a systematic manner so that it works in the favor of the company and assist the management to compete with some of the key competitors in the market. The project would have some major risks as well, and the same is explained in the table below, along with the countermeasures for such risks.
| Risks | Measures |
| There is a significant liquidity risks where it is possible that the business might not have the necessary funds to meet the working capital requirements as well as regular capital expenditures for the project. | A measure which can be implemented by the business is to ensure that a line of credit is maintained or some reserves are maintained so that funding requirements are never an issue. |
| One of the risks is that the technology level is changing and there is a chance that the implemented software design might get obsolete. | The management needs to ensure that they are regularly updating the system and ensuring that the technology level is updated |
The analysis which is presented above makes it clear that the project is a viable option as it would enhance the reach of the company and enhance the capacity at which the business operates. There is further a high chance that the business would be able to generate profits from its operations and further grow in the market. In an overall basis, it can be suggested to the management of Next Plc that they should make investments in the project as it is feasible and there is a high chance that the business would be generating profits from the same.
The analysis which is presented above appropriately shows the financial situation for the business of Next Plc and opportunities which the business has in terms of expanding its operations. The analysis shows the positioning of the business, which is a high-growth company, and the business is looking to create brand loyalty in the market. Further, the analysis assesses the investments made by the management in software and supply chain improvement. On the basis of the analysis, it can be said that the business would be able to generate higher profits from its operations if the project is implemented.
Next PLC (2023) Available at: https://www.nextplc.co.uk/~/media/Files/N/Next-PLC-V2/documents/2022/annual-reports-and-account-jan-2022.pdf
Nosratabadi, S., Mosavi, A., Shamshirband, S., Zavadskas, E.K., Rakotonirainy, A. and Chau, K.W., 2019. Sustainable business models: A review. Sustainability, 11(6), p.1663.
https://www.mdpi.com/2071-1050/11/6/1663
Perry, P., Wood, S. and Fernie, J., 2015. Corporate social responsibility in garment sourcing networks: Factory management perspectives on ethical trade in Sri Lanka. Journal of Business Ethics, 130, pp.737-752.
https://s3.eu-central-1.amazonaws.com/eu-st01.ext.exlibrisgroup.com/44SUR_INST/storage/alma/37/3D/C8/D0/7F/46/C8/87/9F/5D/A6/D2/DB/99/D5/68/
Corporate%20Social%20Responsibility%20in%20Garment%20Sourcing%20Networks%202014%20-%20Accepted%20for%20website.pdf?response-content-type=application%2Fpdf&X-Amz-Algorithm=AWS4-HMAC-SHA256&X-Amz-Date=20231201T173806Z&X-Amz-SignedHeaders=host&X-Amz-Expires=119&X-Amz-Credential=AKIAJN6NPMNGJALPPWAQ%2F20231201%2Feu-central-1%2Fs3%2Faws4_request&X-Amz-Signature=2b4215e81684be7dd6316aaeb9d507db5b4355646282e9b42243928fa8cc4502
Thompson, J. and McLarney, C., 2017. What effects will the strategy changes undertaken by next Plc have on themselves and their competition in the UK Clothing Retail Market?. Journal of Commerce and Management Thought, 8(2), p.234.
https://thuvienso.hoasen.edu.vn/bitstream/handle/123456789/11644/Contents.pdf?sequence=1&isAllowed=y
Wild, J.J., Shaw, K.W. and Chiappetta, B., 2018. Financial and managerial accounting: Information for decisions. McGraw-Hill.
https://thuvienso.hoasen.edu.vn/bitstream/handle/123456789/12021/Contents.pdf?sequence=1&isAllowed=y
Are you confident that you will achieve the grade? Our best Expert will help you improve your grade
Order Now


